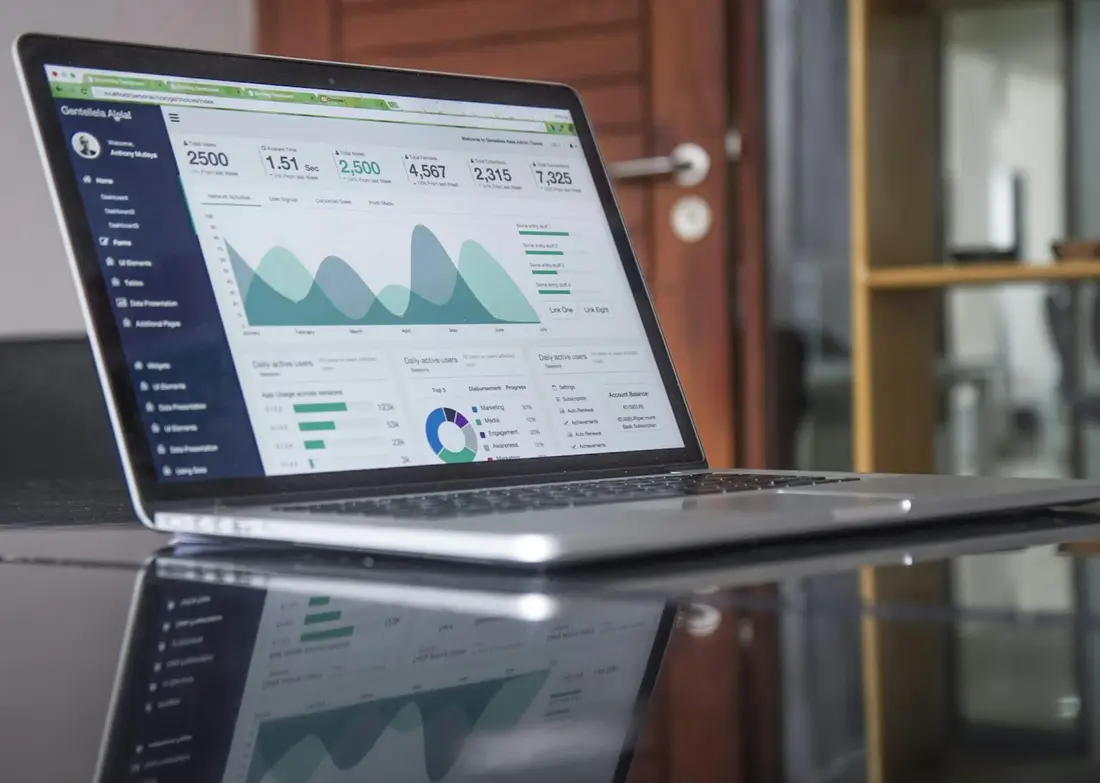

Strategy backtesting for retail traders

Helping traders find their edge.

Send us your strategy and we'll test it properly, with clean data, real costs and a long list of checks built to break it. If it survives, you'll know why. If it doesn't, better to find out here than in your trading account.

  • Any strategy
  • Walk-forward tested
  • Monte Carlo simulation
Scroll
Build.Test.Evaluate.Improve.✦Evidence over promises✦ Build.Test.Evaluate.Improve.✦Evidence over promises✦

What we do

Backtesting, done properly.

Bring any strategy. We'll try our best to break it.

Most backtests are built to look good. Ours are built to find the problems: look-ahead bias, missing costs, a parameter that only works at one exact value, a year that carried all the profit. We run your strategy through the same nine-phase process every time and write up what we find in plain English.

  • Indicator & price action
  • Equities & F&O
  • Intraday or positional
  • Existing EAs
Request a backtest →

Monte Carlo simulation

Illustrative

One backtest is one path through history. Reshuffle the trades a few thousand times and you see how bad the drawdowns could realistically get.

If it passes

You get the numbers, the risk limits and a forward-testing plan to take it further.

If it fails

We'll show you exactly where and why. That's money you didn't lose.

A backtest is a hypothesis, not proof. We treat it that way.

Our process

From idea to live trading, in nine phases.

Every phase is there to catch one specific way strategies fail. Most failures happen in the boring middle steps, so those are the ones we never skip.

Hand writing a checklist in a notebook 01

Define the strategy

Before any testing, we write down why this should make money and who's on the losing side of your trade.

  • Rules clear enough that two people would take identical trades
  • Entries, exits, sizing and filters all spelled out
  • Pass/fail criteria agreed before we see a single result

Catches strategies with no real reason to work
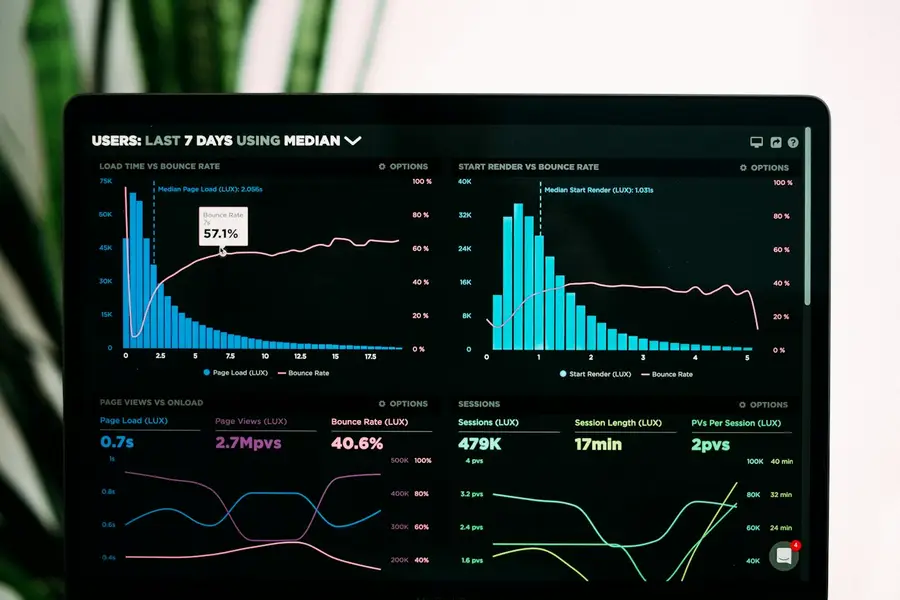
Data dashboard with histograms on a monitor 02

Prepare the data

Bad data gives you confident, wrong answers. So we clean it first, and split it before anyone looks.

  • Bull, bear, sideways and crash years like 2008 and 2020
  • Splits, bonuses, dividends and symbol changes adjusted
  • Delisted stocks kept in, F&O rollovers handled

Catches survivorship bias and dirty data

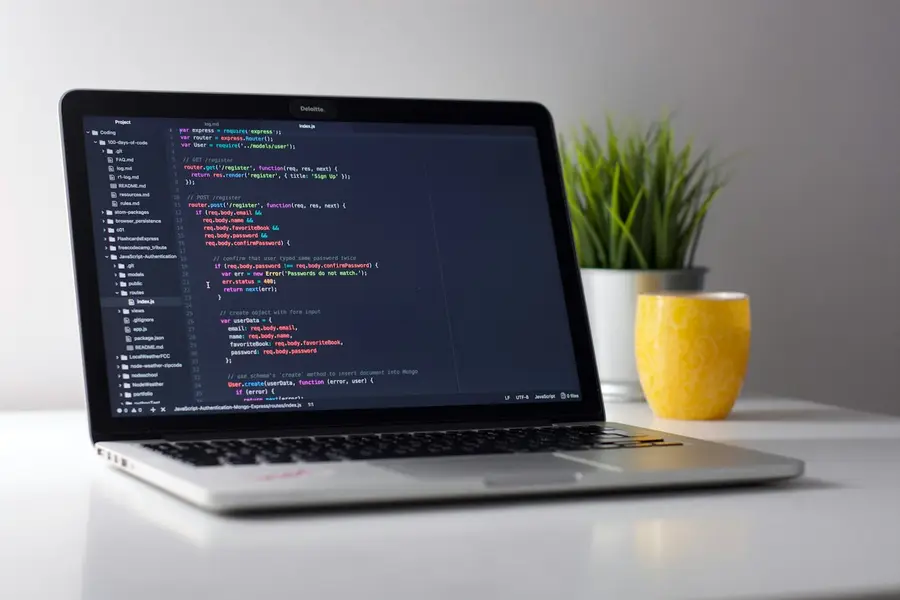
Laptop showing code on a clean desk 03

Build a realistic backtest

The test only gets information you'd actually have had at that moment, and it pays every rupee of cost.

  • No look-ahead, no repainting indicators
  • Brokerage, STT, exchange fees, SEBI fees, GST, stamp duty
  • Slippage, spreads, and stops that gap through

Catches profits that only exist on paper

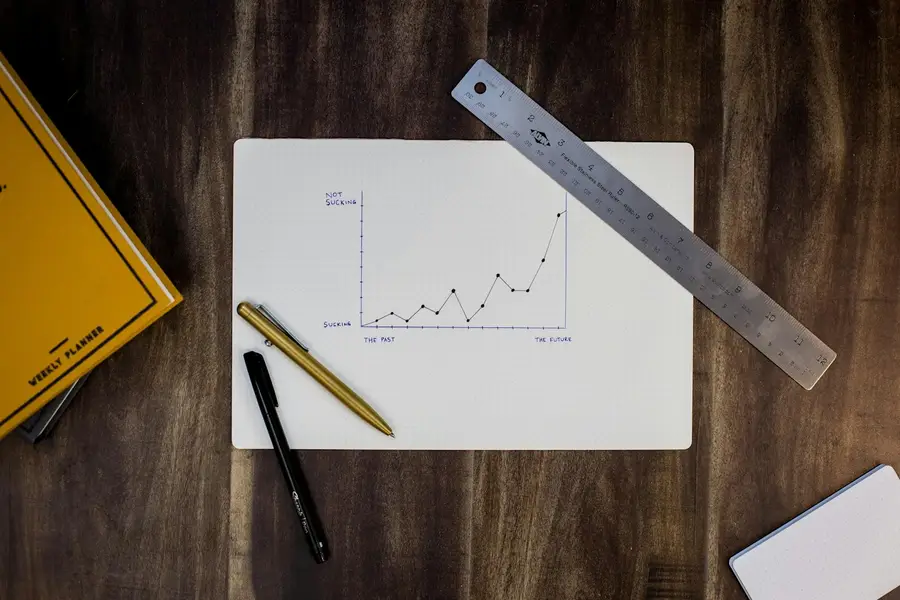
Hand-drawn chart on paper next to a ruler and pens 04

Evaluate the results

Total return is the least interesting number. We look at how the money was made, and when.

  • Expectancy, profit factor, drawdown and how long it lasted
  • Strip out the top 5 to 10 trades. Does it still work?
  • Compared against simply holding the Nifty

Catches a few lucky trades posing as an edge

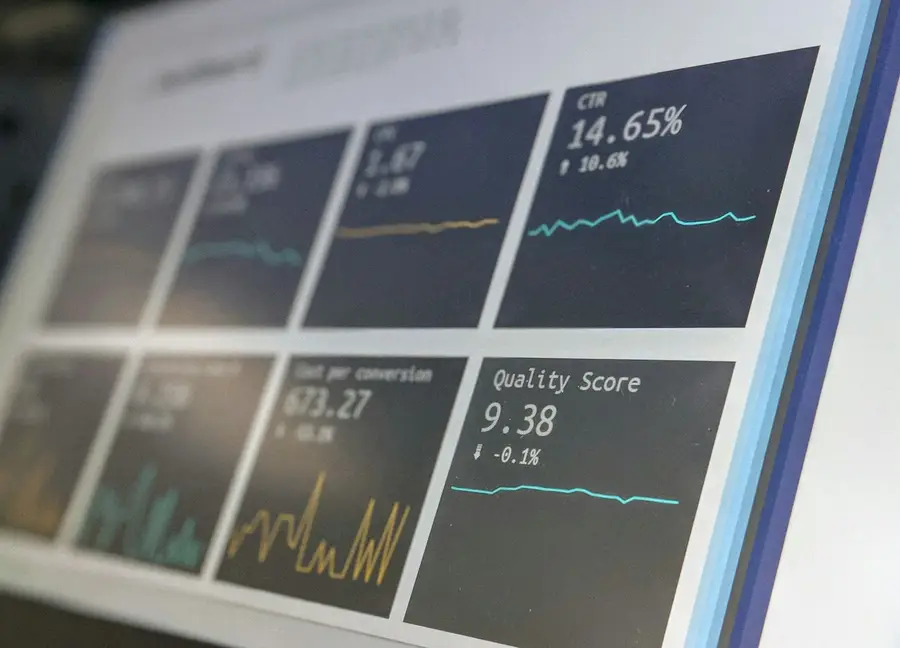
Monitor showing several metric panels 05 Most skipped

Robustness & overfitting

The most important phase, and the one most people skip. This is where we really try to break it.

  • Parameter sensitivity, walk-forward and Monte Carlo
  • Double the costs, delay entries, add noise
  • The holdout data gets opened exactly once

Catches curve-fitting, the big one

Person writing notes at a desk 06

Plan the risk

A good strategy with bad sizing can still empty an account. We set the limits while everyone's calm.

  • Risk 0.5 to 2% per trade, or volatility-based sizing
  • Daily, weekly and total drawdown limits
  • A kill switch you agree to before going live

Catches one bad run wiping you out

Laptop displaying live data dashboards 07

Forward test

Weeks to months on live data, without real money, to check that reality agrees with the backtest.

  • Live signals match what the backtest would have taken
  • Fills and slippage are as realistic as we assumed
  • Rejections, partial fills and outages planned for

Catches gaps between the model and the market

Tidy desk with a laptop running code 08

Go live, slowly

Start at 10 to 25% of the size you want. The goal here isn't profit yet. It's checking execution and your own nerves.

  • Live results tracked against the backtest
  • Some degradation is normal. A big gap means stop.
  • Size up only after a meaningful sample

Catches execution surprises, early and cheaply

Two people reviewing printed results beside a laptop 09

Keep watching

Markets change and edges fade. A strategy that worked last year owes you nothing this year.

  • A trade journal, including every manual override
  • Monthly or quarterly reviews against expectations
  • The kill switch decides, not emotion

Catches an edge that quietly stopped working

Phase 05, up close

A perfect backtest isn't the goal. A trustworthy one is.

Tweak a strategy long enough and it'll fit any stretch of history perfectly. Then it falls apart on the next one. Here's how we tell a real edge from a lucky fit.

Overfitted
  • ✕ Hits every past point, explains nothing
  • ✕ Works at exactly one parameter value
  • ✕ Found after trying 200 variations
Robust
  • ✓ Follows the trend, ignores the noise
  • ✓ Neighbouring parameters work too
  • ✓ Few rules, a clear reason to exist

Parameter sensitivity

Look for a plateau, not a peak

A 20-period average should still work at 18 or 22. If only one exact value makes money, it's been curve-fitted.

Walk-forward analysis

Tune on one window, test on the next

We optimise on a rolling window, test on the unseen data right after it, then roll forward and repeat. That's how you'd really re-tune and trade over time.

The data split

Split before anyone looks

The most recent 20% stays locked until the very end, and we open it once. If the strategy fails there, we don't tweak it and try again. That would just make it more in-sample data.

Cleaned out before the first test

  • Survivorship bias
  • Look-ahead bias
  • Repainting indicators
  • Missing bars & bad ticks
  • Timezone errors
  • Unadjusted splits & bonuses

Monte Carlo

Thousands of alternate histories

Reshuffling the trade order shows the realistic range of drawdowns and losing streaks, not just the one path that happened.

Stress tests

Make life harder on purpose

  • Double the slippage and costs
  • Delay every entry by one bar
  • Add a little noise to prices
  • Run it on markets it wasn't built for

Count the attempts

200 tries is a red flag

If it took 200 variations to find one that works, it's probably luck. We log every version we test, and we'll take fewer rules over clever ones.

Kill switch

Decided before day one

For example: if live drawdown goes past 1.5× the backtest's worst, or results leave the Monte Carlo 95% range, trading stops and we review.

Charts on this page explain concepts. None of them are real performance data.

Your report

The numbers we look at, and why.

You won't get a single big return figure and a nice-looking curve. You'll get the numbers that tell you whether the strategy is actually any good, explained so they make sense.

Laptop on a desk showing an analytics report

Number of trades

Fewer than about 100 and it's hard to tell skill from luck.

Expectancy

The average profit per trade after costs. This is the number that pays the bills.

Profit factor

Gross profit over gross loss. Around 1.3 to 1.5 after costs is decent. Above 3, we get suspicious.

Max drawdown, and how long it lasted

How deep it went and how long it took to recover. Could you honestly sit through that?

Sharpe, Sortino, CAGR ÷ drawdown

How much return you got for the risk you took.

Win rate with average win vs loss

Neither means much on its own. A 30% win rate can be great, and so can 80%.

Longest losing streak

Expect it to be worse live. Better to know now.

Versus the benchmark

Did it beat simply buying and holding the Nifty, after costs and risk? If not, why bother?

Before real money

The pre-live checklist.

Twelve boxes. A strategy goes live with us only when every one is ticked.

  1. A clear, logical edge, written down
  2. Rules that can be coded without guessing
  3. Clean data, no survivorship bias
  4. No look-ahead bias anywhere
  5. All costs and slippage included
  6. 100+ trades across different market regimes
  7. Stable when parameters change
  8. Passed walk-forward and Monte Carlo
  9. Passed the holdout test, first time
  10. Position sizing and kill switch defined
  11. Forward test matches the backtest
  12. Started small, with rules for scaling up

A backtest is a hypothesis, not proof. Every step after the first one is there to try and break the strategy. Only what survives deserves real money. Evidence over promises.

How we work

Four things we won't compromise on.

01

Systematic

Same process, every strategy, every time. No shortcuts because a result looks good.

02

Evidence-led

We show our working, and past results never guarantee future ones.

03

Plain-spoken

If we can't explain a result simply, we haven't understood it well enough yet.

04

Responsible

Every test has limits, and so does automation. We'll always tell you what they are.

Questions

Straight answers.

If we can't answer something honestly, we'll say so.

What kind of strategies can you test?

Pretty much anything that can be written as rules: indicator-based, price action, breakouts, mean reversion, intraday or positional, equities or F&O, or an EA you already have. If part of your strategy is gut feel, we'll work through it with you until it's precise enough to test.

What if my strategy fails?

Then the process did its job. We'll show you where it broke, whether that's costs, one lucky year or a fragile parameter, and whether there's anything worth rethinking. Finding out in a report is a lot cheaper than finding out in your account.

What exactly is overfitting?

It's when a strategy has been tuned so closely to past data that it's learned the noise instead of a real pattern. It looks amazing in the backtest and then stops working. Parameter sensitivity, walk-forward testing and a one-time holdout are how we catch it.

Why do Monte Carlo simulation at all?

Your backtest is one sequence of trades. Shuffle that order or randomly skip trades a few thousand times and you get a realistic range of drawdowns and losing streaks. That range is what you should plan your risk around, not the single path that happened.

Does a strategy that passes guarantee profits?

No. Markets change and edges fade, and nobody can promise future returns. A properly tested strategy just gives you much better odds of knowing what you're getting into. That's also why we forward test and go live small.

Do I need to know how to code?

No. Explain how you trade and we'll handle the rules, the code and the testing. If you plan to automate later, check your broker's and SEBI's current rules for retail algo trading, because API access and registration requirements apply.

Got a strategy?

Let's find out if it's real.
Before your money does.

Tell us how you trade. We'll come back with a plan for testing it and an honest idea of what to expect.